Ever found yourself staring at a blank spreadsheet, wondering whether to open Microsoft Excel or Google Sheets? You’re not alone. This is one of the most common dilemmas for anyone needing to organize data, crunch numbers, or collaborate on projects. While both tools are powerhouse spreadsheet applications, they cater to different needs and excel in different areas.
At AskByteWise.com, our mission is “Making Complex Tech Simple.” Today, we’re diving deep into an Excel vs. Google Sheets: A Complete Feature Comparison. By the end of this definitive guide, you’ll have a crystal-clear understanding of their core functionalities, unique strengths, and practical applications, empowering you to choose the best tool for your next task, whether you’re a student managing a group project or a data analyst dissecting quarterly sales figures.
The Foundation: Desktop vs. Cloud
The most fundamental difference between Excel and Google Sheets lies in their architecture. Understanding this distinction is key to appreciating their subsequent feature sets.
Excel: The Desktop Powerhouse
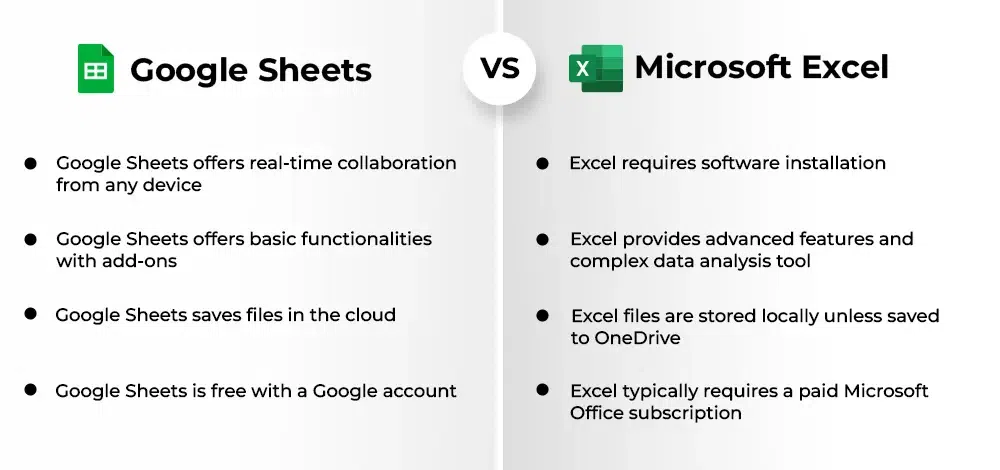
Microsoft Excel has been the industry standard for decades. It’s primarily a desktop application installed directly on your computer, meaning its performance is tied to your hardware.
- Local Files: Your work is saved as
.xlsxfiles (or older formats) locally on your hard drive, network drive, or a cloud service like OneDrive. This gives you ultimate control over where your data resides. - Robust Processing: Because it leverages your computer’s CPU and RAM, Excel is exceptionally good at handling massive datasets (millions of rows) and performing complex calculations without breaking a sweat, especially on powerful machines.
- Offline First: You don’t need an internet connection to use Excel. You can work entirely offline, saving your changes locally and syncing them later if you choose to use a cloud service.
Tip: Excel’s processing power makes it a go-to for data analysts dealing with large data imports, intricate financial models, and computationally intensive tasks.
Google Sheets: The Cloud-Native Collaborator
Google Sheets, on the other hand, was born in the cloud. It’s a web-based application that lives entirely in your browser, accessible from any device with an internet connection.
- Real-time Sync: All your work is automatically saved and synced to Google Drive. This eliminates the worry of losing unsaved changes and makes collaboration incredibly seamless.
- Accessibility: You can access your spreadsheets from any computer, tablet, or smartphone without needing to install specific software. Just open a browser and log into your Google account.
- Performance Considerations: While Sheets has improved significantly, its performance can be affected by your internet connection and the complexity/size of your spreadsheet. Very large datasets can sometimes cause slowdowns.
Important Note: Google Sheets is inherently designed for the internet-connected world, emphasizing accessibility and real-time collaboration.
Core Functionality: Formulas & Functions
At their heart, both Excel and Google Sheets are about crunching numbers and manipulating data using formulas and functions. They share a common language, but each has its unique dialects.
Similarities: The Universal Language of Spreadsheets
The vast majority of essential formulas you use in one will work flawlessly in the other. This makes transitioning between the two remarkably straightforward for basic tasks.
Let’s look at some universal examples:
-
Calculating a Sum: To add up a range of numbers in cells B2 through B10:
=SUM(B2:B10)- SUM(): The function that adds all the numbers in the specified range.
- B2:B10: The range of cells to be summed.
-
Finding an Average: To determine the average of those same sales figures:
=AVERAGE(B2:B10)- AVERAGE(): Calculates the arithmetic mean of the numbers in the range.
-
Conditional Logic with IF: To categorize sales performance based on a threshold:
=IF(C2>5000, "High Performer", "Needs Improvement")- IF(): A logical function that checks a condition.
- C2>5000: The condition (Is the value in cell C2 greater than 5000?).
- “High Performer”: The result if the condition is TRUE.
- “Needs Improvement”: The result if the condition is FALSE.
-
Looking Up Data with VLOOKUP: To find a product’s price from a table:
=VLOOKUP(E2, A:B, 2, FALSE)- VLOOKUP(): Searches for a value in the first column of a table and returns a value in the same row from a specified column.
- E2: The value you want to look up (e.g., “Product A”).
- A:B: The table array where the lookup should occur (the entire columns A and B).
- 2: The column index number from which the matching value should be returned (the second column in A:B is B).
- FALSE: Ensures an exact match.
Differences: Where They Diverge
While the basics are identical, each platform offers specialized functions that reflect its primary use case and environment.
Excel’s Edge: Advanced Analytical & Financial Functions
Excel boasts a more extensive library of advanced functions, particularly in areas like statistics, engineering, and finance. For complex modeling, these can be crucial.
- Financial Functions: Functions like XIRR (Extended Internal Rate of Return) for calculating the internal rate of return for a schedule of cash flows that is not necessarily periodic, and PV (Present Value), FV (Future Value) are staples for financial analysts.
- Statistical & Forecasting: Excel’s suite for statistical analysis and time-series forecasting (e.g., FORECAST.ETS, CONFIDENCE.T) is often more comprehensive and robust.
- Array Formulas: While both support array formulas, Excel’s implementation, especially with newer dynamic array functions like FILTER, SORT, UNIQUE, SEQUENCE, RANDARRAY, and SINGLE, offers incredibly powerful data manipulation capabilities that were traditionally harder to achieve.
Sheets’ Edge: Web-Specific & Collaborative Functions
Google Sheets, leveraging its cloud-native nature, includes unique functions that interact with web services and other Google products.
-
=IMPORTHTML()/=IMPORTDATA()/=IMPORTFEED(): These functions allow you to pull data directly from web pages, RSS feeds, or CSV/TSV files on the web. Imagine pulling a stock table from a finance website directly into your sheet!
=IMPORTHTML("https://en.wikipedia.org/wiki/List_of_S%26P_500_companies", "table", 1)- IMPORTHTML(): Imports data from a table or list within an HTML page.
- “URL”: The URL of the webpage.
- “table”: Specifies that you want to import a table (can also be “list”).
- 1: The index number of the table/list on the page (the first table is 1).
-
=GOOGLEFINANCE(): This is a fantastic function for financial analysis, pulling real-time and historical stock data, currency exchange rates, and more.
=GOOGLEFINANCE("GOOGL", "price")- GOOGLEFINANCE(): Fetches current or historical securities information from Google Finance.
- “GOOGL”: The ticker symbol for the security.
- “price”: The attribute you want to retrieve (e.g., “open”, “high”, “volume”, “marketcap”).
-
=IMPORTRANGE(): A powerful function unique to Google Sheets that allows you to import data from another Google Sheet. This is invaluable for connecting different sheets for reporting or dashboarding.
=IMPORTRANGE("123abcXYZ_spreadsheet_ID", "Sheet1!A1:B10")- IMPORTRANGE(): Imports a range of cells from a specified spreadsheet.
- “spreadsheet_ID”: The ID of the spreadsheet you want to import from (found in its URL).
- “Sheet1!A1:B10”: The specific range within that spreadsheet.
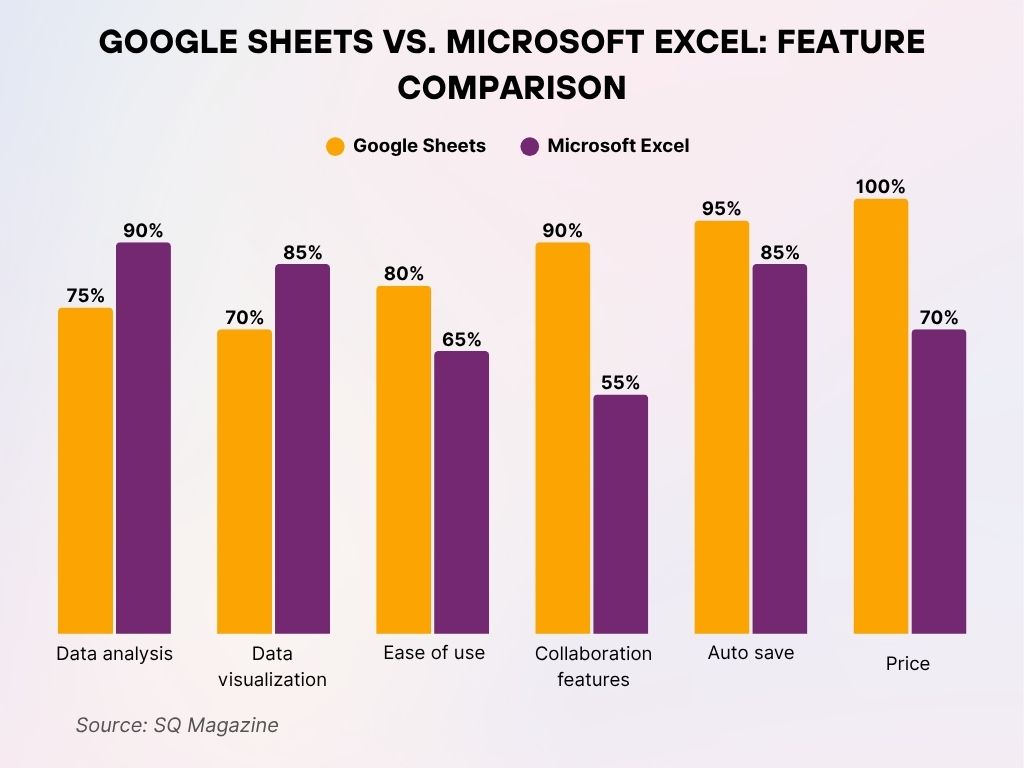
Data Analysis & Visualization
Both tools are excellent for analyzing and visualizing data, but they offer different levels of depth and user experience.
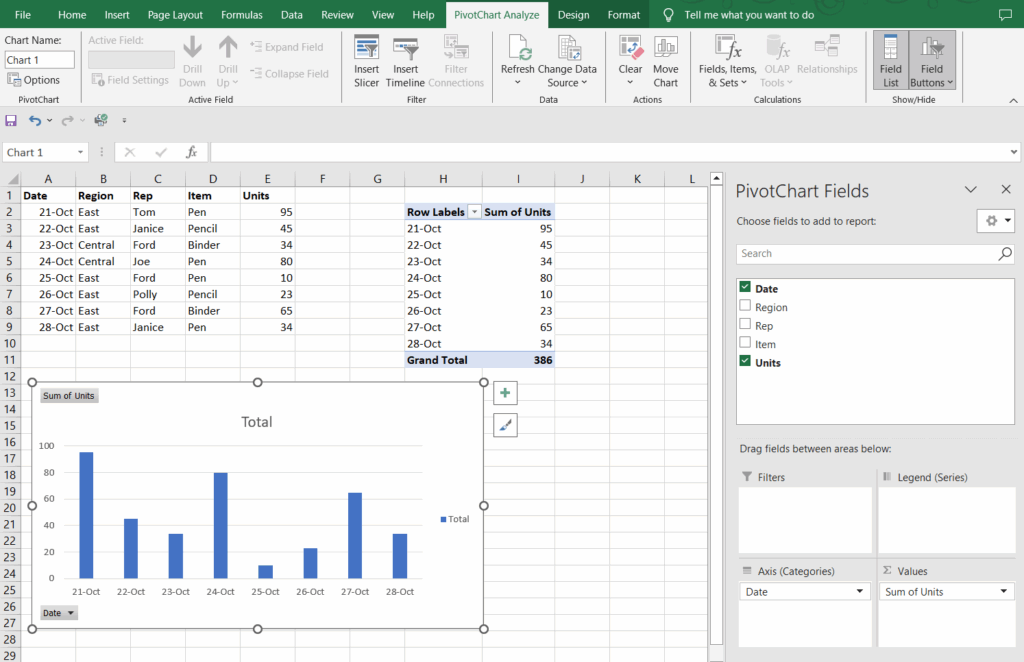
Pivot Tables: Summarizing Your Data
Pivot tables are indispensable for summarizing and analyzing large datasets. Both Excel and Google Sheets offer robust pivot table functionality.
-
Select Your Data: Highlight the range of cells you want to analyze.
-
Insert Pivot Table:
- Excel: Go to Insert > PivotTable.
- Google Sheets: Go to Data > Pivot table.
-
Define Rows, Columns, Values, Filters: Drag and drop your data fields into the respective areas in the Pivot Table Builder/Editor pane.
- Example: To analyze total sales per product category:
- Drag “Category” to Rows.
- Drag “Sales” to Values (ensuring it’s set to SUM).
- Example: To analyze total sales per product category:
While the core functionality is similar, Excel generally provides more advanced options for custom calculations, grouping, and formatting within pivot tables, catering to highly specialized analytical needs. Google Sheets’ pivot tables are simpler to use, often faster for basic analysis, and great for collaborative quick insights.
Charts & Graphs: Telling Your Data Story
Both Excel and Google Sheets provide a wide array of chart types (bar, line, pie, scatter, etc.) to visualize your data.
- Creation: Select your data, then go to Insert > Chart (Excel) or Insert > Chart (Sheets). Both will try to suggest the best chart type automatically.
- Customization: You can customize titles, labels, colors, axis scales, and more in both.
Excel’s Advanced Charting
Excel often boasts more granular control and advanced charting features:
- Sparklines: Tiny charts embedded within a single cell, providing a quick visual trend for a row or column of data.
- Combo Charts: Easily combine different chart types (e.g., a bar chart for sales with a line chart for profit margin on a secondary axis).
- More Chart Types: Historically, Excel has offered a slightly broader range of niche chart types and more sophisticated 3D options, though Sheets is catching up.
Sheets’ Simplicity and Integration
Google Sheets excels in simplicity and integration:
- Easy Sharing: Charts are automatically linked to your sheet and update in real-time. They are easily embedded into Google Docs or Google Slides.
- Exploratory Data Analysis: Sheets’ “Explore” feature (found in the bottom right corner) uses AI to suggest charts, pivot tables, and answer natural language questions about your data, which is incredibly helpful for quick insights.
Data Validation & Conditional Formatting
These features help maintain data quality and highlight important information. Both platforms offer robust options.
-
Conditional Formatting:
- Purpose: Automatically apply formatting (colors, fonts, borders) to cells based on their values or specific rules.
- Example: Highlighting sales figures above a target.
- Excel/Sheets: Select the range (e.g., C2:C100). Go to Home > Conditional Formatting (Excel) or Format > Conditional formatting (Sheets).
- Choose “Highlight Cells Rules” (Excel) or “Format rules” (Sheets).
- Set the rule: Cell value
is greater than5000. Choose a green fill.
- Another Example: Highlighting overdue tasks based on a date column D (containing due dates) and today’s date.
- Select the range, create a new rule.
- Excel/Sheets: Use a custom formula:
=D2<TODAY()(assuming D2 is the first cell in your range). Apply a red fill.
-
Data Validation:
- Purpose: Restrict what users can enter into a cell, preventing errors and ensuring data consistency.
- Example: Creating a dropdown list for “Department”.
- Excel/Sheets: Select the cell(s) (e.g., A2). Go to Data > Data Validation.
- Choose “List from a range” (Sheets) or “List” (Excel).
- Specify your list items (e.g., “Sales, Marketing, HR”) or a range of cells containing the department names.
- Add an input message or error alert if desired.
Collaboration & Sharing
This is where the cloud-native design of Google Sheets truly shines, though Excel has made significant strides in recent years.
Real-Time Co-editing: Google Sheets’ Strong Suit
Google Sheets was built from the ground up for collaboration.
- Simultaneous Editing: Multiple users can edit the same spreadsheet at the exact same time. You’ll see their cursors moving in real-time, indicating where they are working.
- Instant Updates: Changes are saved automatically and immediately visible to everyone with access.
- Comment System: Robust commenting allows users to discuss specific cells or ranges, assign tasks, and resolve issues directly within the sheet.
- Version History: Every single change is tracked and logged, allowing you to easily review past versions, see who made what changes, and revert to an earlier state if needed.
Excel’s Co-authoring (OneDrive/SharePoint): Catching Up
Excel now supports co-authoring, but it typically requires files to be saved in Microsoft’s cloud services (OneDrive or SharePoint).
- Cloud Dependency: For real-time co-authoring, your Excel file needs to be stored on OneDrive, OneDrive for Business, or SharePoint. Local files don’t support it.
- Performance & Sync: While it works, some users report that Excel’s co-authoring can sometimes be less fluid or have slight syncing delays compared to Google Sheets, especially with very active, numerous collaborators.
- Version History: Similar to Sheets, Excel also offers a version history when files are stored in the cloud, allowing you to review and restore previous versions.
Automation & Extensibility
When your spreadsheet tasks become repetitive, automation can save countless hours. Both platforms offer powerful tools for this, but with different underlying technologies.
Excel: VBA & Add-ins
Excel has a long history of powerful automation and extensibility.
-
VBA (Visual Basic for Applications): This is Excel’s built-in programming language. With VBA, you can:
- Record Macros: Automate repetitive sequences of clicks and keystrokes without writing any code.
- Write Custom Functions: Create your own functions beyond Excel’s built-in library.
- Develop Complex Scripts: Build sophisticated automation scripts to manipulate data, generate reports, or interact with other Microsoft Office applications.
- E-E-A-T Example (Concept): A data analyst might use VBA to automatically import data from a specific file path, clean it by removing duplicates, and then format a report based on dynamic criteria.
Important Note: VBA macros are powerful but require a specific programming language (Visual Basic) and are typically desktop-bound.
-
Excel Add-ins: The Microsoft Store and third-party developers offer a vast ecosystem of add-ins that extend Excel’s functionality for specific tasks, from advanced data analysis tools to specialized financial modeling utilities.
Google Sheets: Apps Script & Add-ons
Google Sheets offers its own set of automation tools, deeply integrated with the Google ecosystem.
-
Apps Script (JavaScript-based): This is Google’s cloud-based scripting language, essentially JavaScript with access to Google’s services. With Apps Script, you can:
- Automate Sheets Tasks: Automate data entry, formatting, trigger actions based on events (e.g., on form submission).
- Integrate with Google Services: Send emails via Gmail, create calendar events, interact with Google Docs, Forms, and more.
- Build Custom Web Apps: Develop simple web applications that interact with your Sheets data.
- E-E-A-T Example (Concept): A data analyst could use Apps Script to automatically send an email notification to sales managers whenever monthly sales figures in a sheet drop below a certain threshold.
function checkSalesAndNotify() { var ss = SpreadsheetApp.getActiveSpreadsheet(); var sheet = ss.getSheetByName("Sales Data"); var lastRow = sheet.getLastRow(); var salesValue = sheet.getRange("B" + lastRow).getValue(); // Assuming sales are in column B if (salesValue < 5000) { // Threshold for low sales MailApp.sendEmail("salesmanager@example.com", "Low Sales Alert!", "Monthly sales are below target: " + salesValue); } }- function checkSalesAndNotify(): Defines the custom function.
- SpreadsheetApp.getActiveSpreadsheet(): Gets the active Google Sheet.
- sheet.getSheetByName(“Sales Data”): Gets a specific sheet by name.
- sheet.getRange(“B” + lastRow).getValue(): Reads the value from the last row of column B.
- MailApp.sendEmail(…): Sends an email using Gmail (assuming permissions are granted).
-
Sheets Add-ons: Similar to Excel, Google Workspace Marketplace offers a wide range of add-ons that extend Sheets’ capabilities, often focusing on web integrations, CRM tools, or specific reporting functions.
Connectivity & Integration
In today’s interconnected world, how well a spreadsheet tool integrates with other services is a crucial factor.
Excel: Power Query, Power BI, SQL Server
Excel offers deep integration within the Microsoft ecosystem and robust data connectivity.
- Power Query: A powerful data connection and transformation tool built into Excel (and Power BI). It allows you to connect to, transform, and combine data from a vast array of sources, including databases, web pages, cloud services, and more, all without coding.
- Power BI: Seamless integration with Microsoft’s business intelligence tool, allowing you to build advanced dashboards and reports from your Excel data.
- SQL Server & Databases: Excellent native connectivity to various databases, making Excel a strong choice for working with structured data warehouses.
Google Sheets: Google Forms, BigQuery, Zapier
Google Sheets shines in its native integration with other Google services and web-based platforms.
- Google Forms: Automatically collects responses from Google Forms directly into a Google Sheet, making it a powerful tool for surveys, registrations, and data collection.
- BigQuery: Strong integration with Google Cloud’s enterprise data warehouse, BigQuery, allowing users to query and analyze massive datasets directly from Sheets.
- Zapier & IFTTT: Because it’s a web-based service, Sheets integrates effortlessly with automation platforms like Zapier and IFTTT, connecting it to thousands of other web applications (CRMs, marketing tools, etc.).
Performance & Scalability
The ability to handle large volumes of data is a critical differentiator for some users.
Large Datasets: Where Excel Shines
- Million-Row Limit: Excel can handle up to 1,048,576 rows and 16,384 columns (XFD). While you might hit performance bottlenecks before reaching these absolute limits, it’s designed to manage incredibly large datasets.
- Local Processing Power: As a desktop application, Excel leverages your computer’s processing power and RAM, making it generally faster for complex calculations and operations on very large files, assuming you have capable hardware.
Browser Limitations: Sheets’ Considerations
- Reduced Row Limit: Google Sheets has a limit of 10 million cells per spreadsheet. While this is substantial, it’s less than Excel’s potential.
- Internet & Browser Dependent: Performance can vary significantly based on your internet speed, browser, and computer’s resources. Very complex formulas or extremely large sheets can sometimes cause slowdowns or browser crashes.
Accessibility & Offline Access
How and where you can work on your spreadsheets also plays a significant role in choice.
Google Sheets: Anywhere, Anytime (Mostly)
- Online First: Sheets is primarily an online tool, requiring an internet connection for full functionality and real-time collaboration.
- Offline Mode: Google Sheets does offer an offline mode (enabled through Google Drive settings). Once enabled, you can view and edit your sheets offline, and changes will sync automatically when you reconnect to the internet.
Excel: Desktop First, Cloud Second
- Full Offline Functionality: As a desktop application, Excel offers complete functionality whether you’re connected to the internet or not. This is a major advantage for users in environments with unreliable or no internet access.
- Cloud Syncing: When connected, you can save and sync your files to OneDrive or SharePoint, enabling cloud backups and co-authoring.
Pricing & Availability
The cost and how you access these tools are often a primary consideration.
Excel: Part of Microsoft 365
- Subscription Model: Microsoft Excel is typically acquired as part of a Microsoft 365 subscription (formerly Office 365), which includes other apps like Word, PowerPoint, and Outlook. Subscriptions can be personal, family, or business-oriented, with annual or monthly fees.
- Perpetual License: Less common now, but you can still sometimes purchase a standalone, one-time license for a specific version of Excel (e.g., Office Home & Business).
- Web Version: A free, somewhat limited web version of Excel is available through your Microsoft account, offering basic functionality.
Google Sheets: Free with a Google Account
- Free for Personal Use: Google Sheets is completely free for anyone with a Google account. This makes it incredibly accessible and a popular choice for students, personal projects, and small businesses.
- Google Workspace: For businesses and organizations, Sheets is part of the paid Google Workspace suite (formerly G Suite), which offers enhanced features, administrative controls, increased storage, and dedicated support.
Common Considerations and Choosing Your Champion
The “best” spreadsheet tool isn’t universal; it’s the one that best fits your specific needs.
When to Choose Excel:
- Heavy Data Analysis & Complex Modeling: If you regularly work with massive datasets (millions of rows), perform intricate statistical analyses, financial modeling, or require highly specific functions, Excel’s raw power and extensive function library are unparalleled.
- Robust Offline Needs: For consistent work without an internet connection, Excel’s desktop-first nature provides reliability.
- Existing VBA Investments: If your organization relies heavily on existing VBA macros for automation, sticking with Excel is essential.
- Specific Industry Add-ins: Certain industries or specialized fields may have critical Excel-only add-ins.
- Integration with Microsoft Ecosystem: If you primarily use other Microsoft Office applications, Power BI, or SQL Server, Excel will offer seamless integration.
When to Choose Google Sheets:
- Real-time Collaboration: For teams that need to work on the same document simultaneously, Sheets’ real-time co-editing is superior and incredibly efficient.
- Web-based Data & Integration: If you frequently pull data from web sources, use Google Forms, or integrate with other web services via Apps Script or platforms like Zapier, Sheets is a natural fit.
- Cost-Efficiency: For individuals and small businesses, the free tier of Google Sheets is a massive advantage.
- Accessibility & Mobility: Working from any device, anywhere, with just a browser is a huge benefit for flexible work environments.
- Lighter Analysis & Quick Insights: For general data organization, basic analysis, and quick visualizations, Sheets provides a friendly and efficient environment.
Common Errors and How to Approach Them (in either tool)
Even the most seasoned data analyst encounters errors. Knowing how to troubleshoot them is crucial.
1. #DIV/0! Errors
- Meaning: You’re trying to divide a number by zero or an empty cell.
- How to Fix: Check the cells referenced in your division formula. Ensure the denominator isn’t zero or blank.
- Pro-Tip (Preventative): Use the
IFERROR()function to gracefully handle potential division by zero.
=IFERROR(A2/B2, "N/A")- IFERROR(): Checks if a value results in an error. If so, it returns a specified value; otherwise, it returns the original value.
- A2/B2: The calculation that might produce an error.
- “N/A”: The value to display if an error occurs. You could also use
0or""(empty string).
2. #N/A Errors (VLOOKUP / XLOOKUP)
- Meaning: The
VLOOKUP(orXLOOKUP) function couldn’t find the lookup value in the specified range. - How to Fix:
- Verify the spelling of your lookup value.
- Ensure the lookup value exists in the first column of your table array.
- Check for extra spaces or inconsistent data types (e.g., looking up a number stored as text).
- Pro-Tip (Preventative): Use
IFNA()(orIFERROR()) to return a custom message when a match isn’t found.
=IFNA(VLOOKUP(D2, A:B, 2, FALSE), "Product Not Found")- IFNA(): Specifically handles
#N/Aerrors, returning a specified value if an#N/Aerror occurs.
- IFNA(): Specifically handles
3. Circular References
- Meaning: A formula refers directly or indirectly to its own cell. This creates an endless loop of calculation.
- How to Fix: Excel and Sheets will usually warn you and point to the problematic cell. Carefully review the formula in that cell and its dependencies to ensure it doesn’t refer back to itself. This often happens accidentally when summing a range that includes the sum cell itself.
4. Date Formatting Issues
- Meaning: Dates might display incorrectly or not be recognized as dates due to regional settings or inconsistent entry formats.
- How to Fix:
- Ensure your cells are formatted as “Date” (not “General” or “Text”).
- Be mindful of regional settings (e.g., MM/DD/YYYY vs. DD/MM/YYYY).
- If importing data, clean the date column to a consistent format. Use functions like
DATEVALUE()if you need to convert text-based dates.
Conclusion: Your Spreadsheet, Your Choice
In the grand Excel vs. Google Sheets: A Complete Feature Comparison, there’s no single “winner.” Both are phenomenal tools that excel in their respective domains. Excel remains the undisputed champion for heavy-duty, complex, offline data analysis and specialized financial modeling. Google Sheets leads the pack in real-time collaboration, web-based integration, and accessibility, especially for cost-conscious users and teams embracing a cloud-first workflow.
As a content strategist at AskByteWise.com, my advice is to understand your primary use case, your team’s collaboration needs, and your budget. Don’t be afraid to experiment with both. Many professionals use a combination of both tools, leveraging Excel’s power for deep dives and Sheets’ agility for collaborative projects. The best tool is ultimately the one that empowers you to work most efficiently and effectively.
Frequently Asked Questions (FAQ)
1. Can I convert Excel files to Google Sheets and vice-versa?
Yes, absolutely! Both platforms support seamless conversion.
- Excel to Sheets: Upload your
.xlsxfile directly to Google Drive, then right-click and choose “Open with Google Sheets.” - Sheets to Excel: In Google Sheets, go to File > Download > Microsoft Excel (.xlsx).
While most data and basic formulas transfer well, very complex Excel-specific features (like advanced VBA macros or niche charting) might not translate perfectly to Sheets.
2. Is Google Sheets really free?
Yes, Google Sheets is entirely free for personal use with any Google account. For businesses and organizations needing advanced features, increased storage, and administrative controls, it’s part of the paid Google Workspace subscription.
3. Which one is better for beginners?
Google Sheets often has a slightly flatter learning curve for beginners due to its simpler interface and real-time collaboration, making it easy to learn with others. Excel, while intuitive for basics, has a vast array of advanced features that can initially seem overwhelming. For basic data entry and simple calculations, both are easy to pick up.
4. Do they use the same formulas?
For the vast majority of common formulas (e.g., SUM, AVERAGE, IF, VLOOKUP), yes, they are identical. However, each platform also has its unique functions. Excel has more advanced statistical/financial functions, while Sheets has unique web-oriented functions like IMPORTHTML and GOOGLEFINANCE.
5. Can I use macros in Google Sheets?
Yes, but not Excel’s VBA macros. Google Sheets uses Google Apps Script, which is a JavaScript-based language for automation. You can write scripts to automate tasks, create custom functions, and integrate with other Google services. You can also record simple macros in Sheets, which generate Apps Script code.
See more: Excel vs. Google Sheets: A Complete Feature Comparison.
Discover: AskByteWise.